
July changes the starting point for energy procurement
Energy markets became significantly more expensive in July 2026. For real estate, the fact that electricity and gas prices rose is less decisive than where price movements occur along the forward curve and which portfolio supply periods they affect.
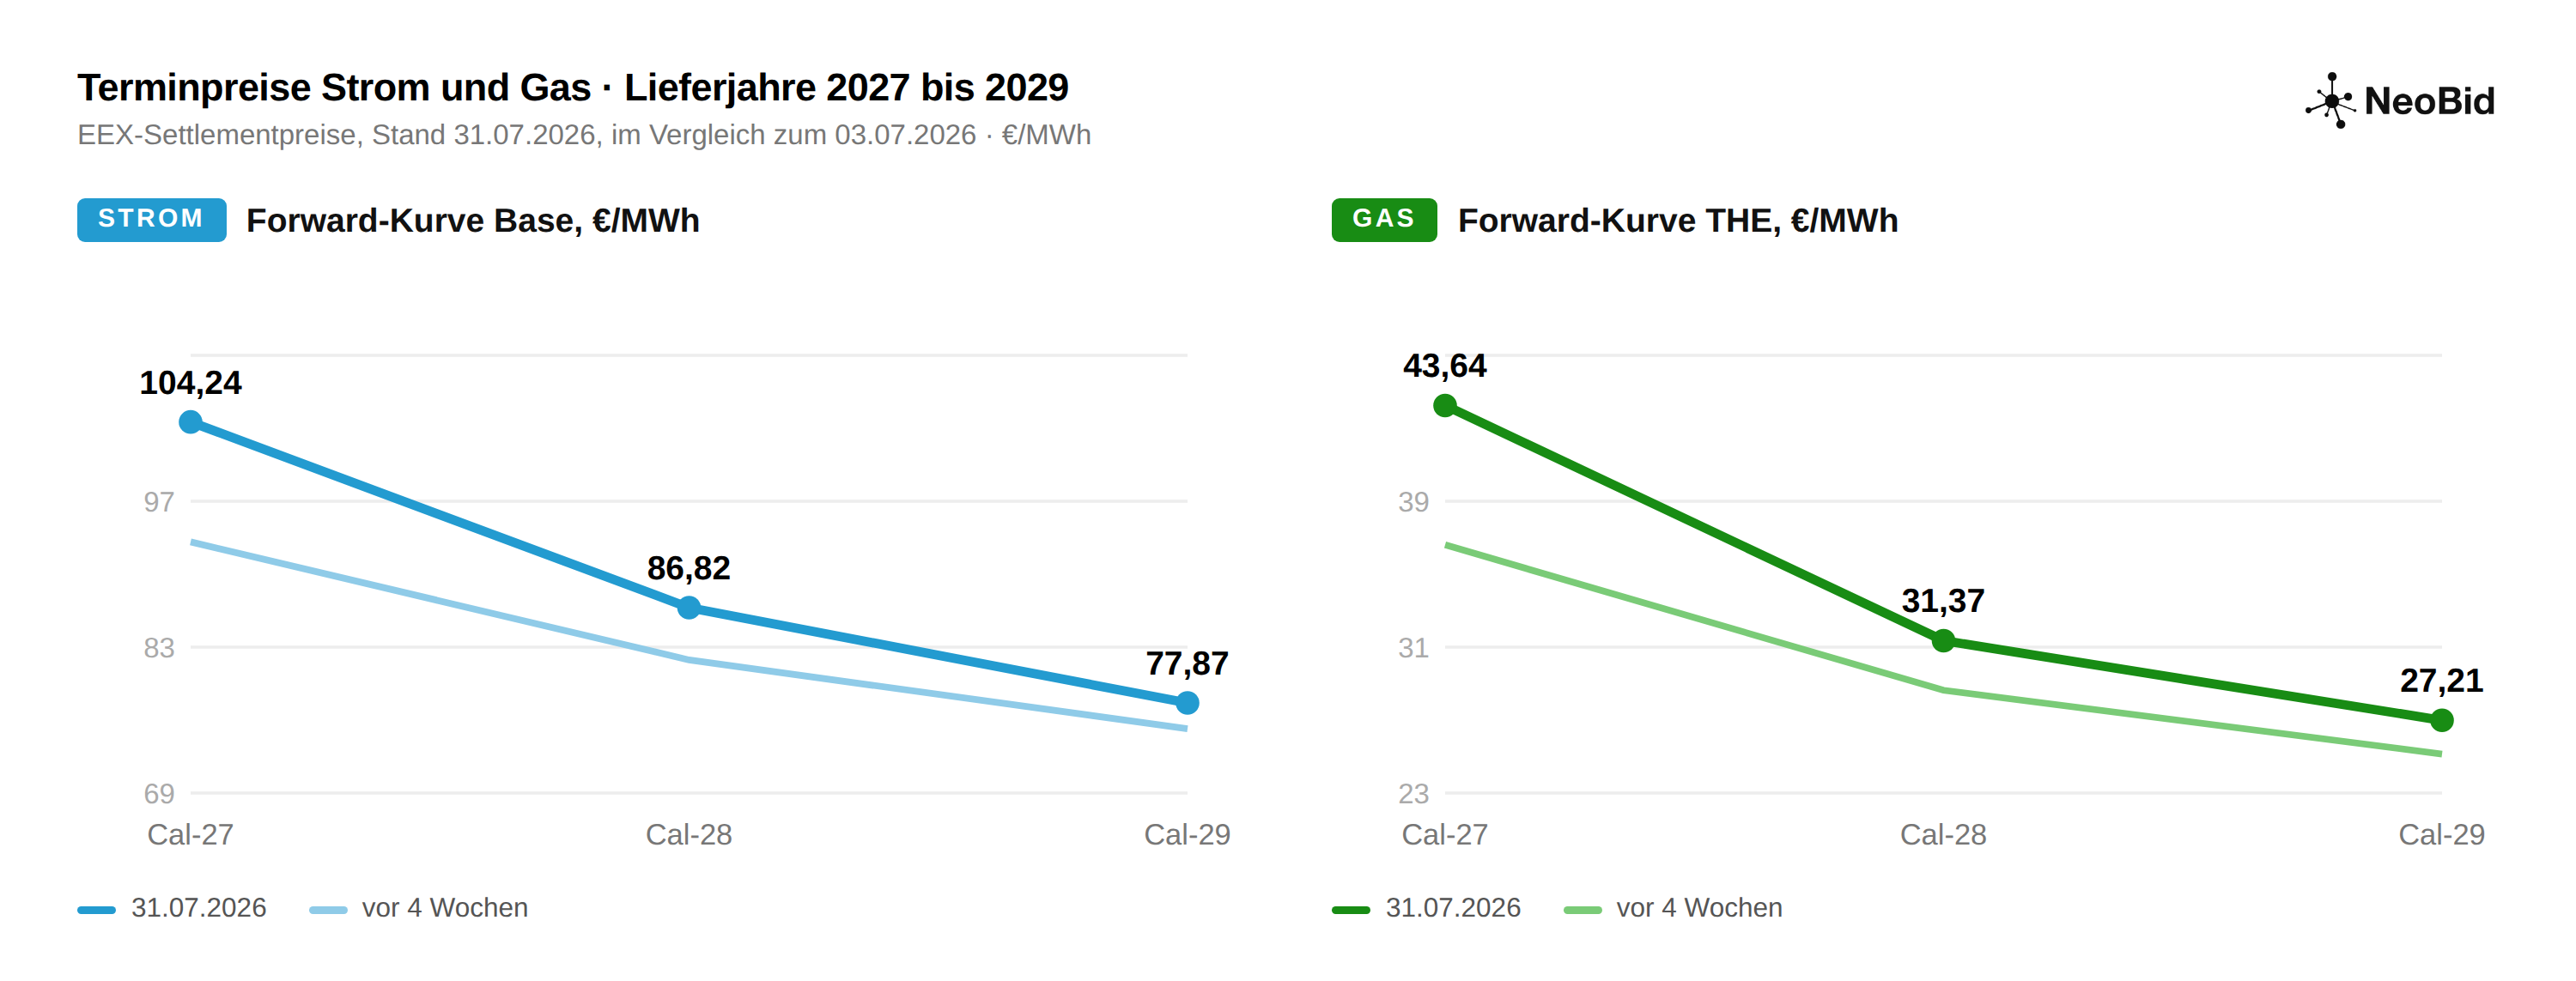
The following values refer to 31 July 2026. “Cal-27” means calendar-year 2027 delivery; “Q4 2026” means the fourth quarter of 2026.
Electricity Cal-27 rose by 12.1% over four weeks to €104.24 per megawatt-hour (€/MWh). The winter quarter Q4 2026 increased by 22.0% to €139.46/MWh.
Gas Cal-27 reached €43.64/MWh, 20.0% above the level four weeks earlier. Q4 2026 rose by 35.7% to €59.94/MWh.
Owners, asset managers and property managers therefore need to consider affected supply periods, consumption volumes and open portfolio positions alongside the annual price.
How price movements change the portfolio budget
The four-week increase in electricity Cal-27 equated to approximately €11,250 per gigawatt-hour of annual consumption. Compared with twelve months earlier, the difference was approximately €21,840 per gigawatt-hour.
For five gigawatt-hours of electricity consumption in 2027, this amounts to around €56,000 in the four-week comparison or €109,000 over twelve months.
These examples show only the change in wholesale value. Network charges, levies, taxes, balancing and sales costs, and supplier margins are excluded. Price-secured volumes are affected differently by subsequent market movements from open volumes.
Higher energy costs may increase operating budgets and tenants’ service charges. Where costs remain with the owner, they directly affect operating cash flow and net operating income (NOI). Energy procurement therefore also concerns financial management within asset management.
Why delivery quarters and consumption profiles matter
At the end of July, electricity Q4 2026 cost €139.46/MWh, compared with €87.35/MWh for Q2 2027. The winter quarter was around 60% above the second quarter of 2027. Gas stood at €59.94/MWh for Q4 2026 and €40.84/MWh for Q2 2027.
An annual contract provides a price for the entire delivery year. For portfolio management, this can conceal differences between quarters. Individual delivery periods therefore deserve attention, particularly in tranche models and multi-year strategies.
Hotels, healthcare properties, care facilities and residential portfolios have different seasonal consumption profiles from logistics or retail portfolios. High heating demand in expensive winter quarters can produce an economic effect substantially different from a simple annual average.
The forward structure reveals different price risks
July’s price movement was uneven across delivery years. Electricity Cal-27 stood at €104.24/MWh, Cal-28 at €86.82/MWh and Cal-29 at €77.87/MWh. Cal-29 was around 25% below the front year. Corresponding gas values were €43.64, €31.37 and €27.21/MWh.
Several factors affected electricity markets simultaneously in July: high temperatures and cooling demand, temporarily restricted French nuclear capacity, weaker wind generation and a substantially higher gas price.
These factors mainly affected nearer-term contracts and winter quarters. Later delivery years reacted much less strongly.
Procuring only shortly before delivery concentrates decisions on the front of the curve. Multi-year procurement allows delivery years and purchasing dates to be considered separately. This does not guarantee lower prices.
Competitors in property energy procurement are also increasingly using structured, longer-term approaches. Recent market examples include multi-year tenders and fixed-price agreements for property portfolios.
Gas: consider storage levels and open supply volumes together
At the end of July 2026, German gas storage was 46.84% full. At the same point in 2025 it was 60.79%, and in 2024 89.19%. The year-on-year gap was therefore around 14 percentage points.
This does not establish an immediate supply shortfall. Lower storage does, however, increase replenishment needs before the heating season and sensitivity to additional demand, cold weather and supply disruptions.
Geopolitical risks and global competition for LNG add to this. Alongside spot prices, property portfolios therefore need to consider the valuation of relevant forward products and which volumes remain open for each delivery period.
Which energy costs remain with the owner
The German CO₂ Cost Allocation Act allocates residential CO₂ costs between tenants and landlords according to specific CO₂ emissions. Non-residential buildings generally use an equal split, subject to statutory exceptions.
The reorientation of heating legislation adopted in 2026 also changes financial calculations. The Building Modernisation Act removes the previous 65% requirement. For certain newly installed fossil-fuel heating systems in existing rented residential buildings, it extends cost sharing.
A heating system should therefore not be assessed solely by its initial investment. Energy, CO₂ and other operating costs retained by the owner over its life also matter. Energy procurement, technical decarbonisation and long-term cash flow planning belong together.
From operating budgets to NOI and investment planning
Not every energy price increase automatically affects NOI. Whether costs can be passed on as operating costs depends on the lease, use and legal framework.
Operating costs: Higher energy prices initially increase the budget and may increase tenants’ total occupancy costs.
Cash flow: Non-recoverable components directly affect the owner.
Lettability: High service charges may impair a building’s competitiveness.
Investment: Energy-intensive or inefficient buildings may consequently face questions about property value and capital expenditure planning.
Energy procurement and decarbonisation should therefore be managed together.
Four review steps for asset and property management
The market picture implies neither immediately fixing every open volume nor generally waiting. The starting point is the portfolio’s remaining price risk.
Consolidate contracts and data: Bring together supply points, contract terms, notice periods, supply starts, annual consumption, measured or standard load profiles, and purchased and open volumes. Complete metering and consumption data provide the foundation.
Create a delivery-year matrix: Show which shares of electricity and gas consumption are already price-secured for 2027, 2028 and 2029.
Check budgets and risk limits: Compare the forward curve with the cost range supported by business planning. Make contract deadlines and tender needs visible to property management.
Review purchasing dates: Spreading purchases over time can reduce the risk of contracting the entire volume during a high-price phase. It does not guarantee a lower average price.
Procurement rules provide guidance
Weather, generation availability, storage developments and geopolitical events complicate short-term price forecasts. Procurement horizon, volume allocation, purchasing dates, contract structure, tender breadth and decision rules can instead be managed.
The July 2026 report shows why these decisions belong together at portfolio level. Transparency about consumption, terms, open volumes and delivery years helps align price risks with cash flow, NOI, operating budgets and decarbonisation strategy.
Further reading: Why purchasing timing alone does not replace a procurement strategy.
Sources and data basis
Historical market data and calculations were taken from the NeoBid 07/2026 market report: exchange reference date 31 July 2026, regulatory position of the original report 20 August 2026. Its named primary sources include EEX, EPEX, SMARD/Federal Network Agency, AGSI/Trading Hub Europe, the Federal Law Gazette, the German government and the European Commission.
EEX publishes official settlement and final settlement data for electricity futures. Linked official legal sources supplement the assessment of owner costs.
How are open price risks distributed across your portfolio?
Discuss with NeoBid how delivery years, contract deadlines and budget limits can be combined within structured energy procurement .